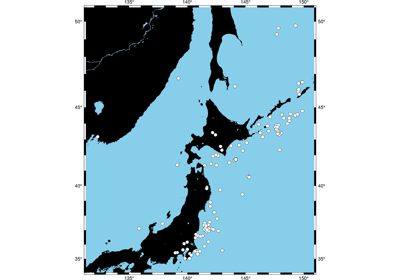
pygmt.Figure.plot
-
Figure.plot(x=None, y=None, data=None, sizes=None, direction=None, **kwargs)¶ Plot lines, polygons, and symbols on maps.
Used to be psxy.
Takes a matrix, (x,y) pairs, or a file name as input and plots lines, polygons, or symbols at those locations on a map.
Must provide either data or x and y.
If providing data through x and y, color (G) can be a 1d array that will be mapped to a colormap.
If a symbol is selected and no symbol size given, then psxy will interpret the third column of the input data as symbol size. Symbols whose size is <= 0 are skipped. If no symbols are specified then the symbol code (see S below) must be present as last column in the input. If S is not used, a line connecting the data points will be drawn instead. To explicitly close polygons, use L. Select a fill with G. If G is set, W will control whether the polygon outline is drawn or not. If a symbol is selected, G and W determines the fill and outline/no outline, respectively.
Full option list at https://docs.generic-mapping-tools.org/latest/plot.html
Aliases:
B = frame
C = cmap
G = color
J = projection
R = region
S = style
U = timestamp
W = pen
X = xshift
Y = yshift
c = ax
i = columns
l = label
p = perspective
t = transparency
- Parameters
x/y (float or 1d arrays) – The x and y coordinates, or arrays of x and y coordinates of the data points
data (str or 2d array) – Either a data file name or a 2d numpy array with the tabular data. Use option columns (i) to choose which columns are x, y, color, and size, respectively.
sizes (1d array) – The sizes of the data points in units specified in style (S). Only valid if using x and y.
direction (list of two 1d arrays) – If plotting vectors (using
style='V'orstyle='v'), then should be a list of two 1d arrays with the vector directions. These can be angle and length, azimuth and length, or x and y components, depending on the style options chosen.projection (str) – Required if this is the first plot command. Select map projection.
region (str or list) – Required if this is the first plot command.
'xmin/xmax/ymin/ymax[+r][+uunit]'. Specify the region of interest.A (bool or str) –
'[m|p|x|y]'By default, geographic line segments are drawn as great circle arcs. To draw them as straight lines, use A.frame (str or list) – Set map boundary frame and axes attributes.
cmap (str) – File name of a CPT file or
C='color1,color2[,color3,...]'to build a linear continuous CPT from those colors automatically.D (str) –
'dx/dy': Offset the plot symbol or line locations by the given amounts dx/dy.E (bool or str) –
'[x|y|X|Y][+a][+cl|f][+n][+wcap][+ppen]'. Draw symmetrical error bars.color (str) – Select color or pattern for filling of symbols or polygons. Default is no fill.
style (str) – Plot symbols (including vectors, pie slices, fronts, decorated or quoted lines).
pen (str) – Set pen attributes for lines or the outline of symbols.
xshift (str) –
[a|c|f|r][xshift]. Shift plot origin in x-direction.yshift (str) –
[a|c|f|r][yshift]. Shift plot origin in y-direction. Full documentation is at https://docs.generic-mapping-tools.org/latest/gmt.html#xy-full.label (str) – Add a legend entry for the symbol or line being plotted.
perspective (list or str) –
'[x|y|z]azim[/elev[/zlevel]][+wlon0/lat0[/z0]][+vx0/y0]'. Select perspective view and set the azimuth and elevation angle of the viewpoint. Default is [180, 90]. Full documentation is at https://docs.generic-mapping-tools.org/latest/gmt.html#perspective-full.transparency (float) – Set transparency level, in [0-100] percent range. Default is 0, i.e., opaque. Only visible when PDF or raster format output is selected. Only the PNG format selection adds a transparency layer in the image (for further processing).
